
Prepared by Gary Gerbrandt • CP 201A/Professor Carolina K. Reid • December 5, 2018
Introduction to Chinatown
Among San Francisco’s neighbourhoods, Chinatown is one of the most visually, culturally, and historically distinct. In 1848, Chinese immigrant labourers settled around Portsmouth Square, the nucleus of the neighbourhood as it stands today. In spite of decades of struggle—from the effects of the Chinese Exclusion Act of 1882, which banned immigration and property rights; to massive fires that destroyed the community following the Earthquake of 1906; to long-term discrimination and explicitly racist displacement pressures from developers and other influential local figures1“The Story of Chinatown,” KQED San Francisco, published July 30, 1997, accessed December 2, 2018, https://www.pbs.org/kqed/chinatown/resourceguide/story.html.—the Chinese community persists, making it the oldest in North America.2“History of San Francisco’s Chinatown,” A&E Television Networks, last modified August 21, 2018, accessed December 2, 2018, https://www.history.com/topics/immigration/san-francisco-chinatown.

Today, Chinatown is a vibrant, thriving, predominantly Asian community immediately adjacent to the Financial District in the heart of San Francisco.3For the purposes of this analysis, I have defined Chinatown as consisting of San Francisco County 2010 Census tracts 106, 107, 108, 110, 111, 112, 113, 118, and 611. However, the pressures of development, gentrification, and displacement are acute, particularly for the lower-income Chinese community that has historically lived and worked in the area. With rising housing prices, and demand by developers for the neighbourhood’s well-located land, these pressures are more salient than ever before. Chinatown is especially vulnerable given its lower-income population; the community’s rich network of civic organizations continues a decades-long fight to protect its residents from displacement.
In the past decade, displacement pressures in Chinatown have risen to critical levels. The Bay Area’s long-standing deficit in housing units built has yawned wider than ever, with a shortage of 29,000 workforce-affordable housing units by 2025.4Ducker et. al., Priced Out: Persistence of the Workforce Housing Gap in the San Francisco Bay Area (Washington, DC: Urban Land Institute, 2009), http://uli.org/wp-content/uploads/ULI-Documents/Priced-Out-San-Francisco-FINAL.pdf, 18. As of September 2018, the megaregion is home to a record 4 million jobs—with 800,000 jobs created since the Great Recession ended in 2010.5George Avalos, “Bay Area Becomes 4-Million-Job Economy as Hiring Boom Widens,” The Mercury News (San Jose, CA), September 21, 2018, https://www.mercurynews.com/2018/09/21/bay-area-becomes-4-million-job-economy-as-hiring-boom-widens/. With more and more offices in and near the city core, the high-paying tech industry has had a disproportionate impact on San Francisco’s established neighbourhoods, with the rapid gentrification of the Mission typifying its ability to displace lower-income ethnic communities in the city.6Cespedes et. al., “Community Organizing and Resistance in SF’s Mission District,” in Case Studies on Gentrification and Displacement in the San Francisco Bay Area, ed. Miriam Zuk and Karen Chapple (Berkeley, CA: Center for Community Innovation, 2015), https://www.urbandisplacement.org/sites/default/files/images/case_studies_on_gentrification_and_displacement-_full_report.pdf, 27-28. Chinatown’s proximity to the Financial District, and the Market Street corridor, may position it for the next wave of urban redevelopment. With the Muni Metro Central Subway planned to open in 2019 or 2020, connecting the area to the region’s core transit network, transit-oriented development poses a near-term threat.7Karen Chapple, Mapping Susceptibility to Gentrification: The Early Warning Toolkit (Berkeley, CA: Center for Community Innovation, 2009), https://communityinnovation.berkeley.edu/sites/default/files/mapping_susceptibility_to_gentrification.pdf, 2.
Analytical Approach
This case study seeks to understand the vulnerability of Chinatown’s residents to displacement in coming years, given rising development pressure in the neighbourhood. First, it contextualizes the history and present of Chinatown’s battles with displacement threats with a brief review of past steps taken by community organizations and city bodies. Second, it turns to indicators that show the disparities between Chinatown and its surroundings, highlighting the potential drivers for displacement the community is up against. Leveraging Census and other data on economic and housing indicators, it seeks to understand the particular threats faced by the community in the near future—with a focus on the vulnerability of its large population of Asian low-income renters. From there, it concludes with a review of findings, limitations to the analysis performed, and potential directions for future research.
Demographic Profile
Before exploring past, present, and future threats from displacement in Chinatown, it makes sense to look at the neighbourhood’s demographics as they stand, compared with San Francisco. Exhibit 2 shows the 2016 ethnic and racial breakdown of the neighbourhood compared with the city.8In this case study, I refer to people who self-identified in the ACS or Census as Asian alone and non-Hispanic as Asian — this is not comprehensive, as it does not reflect people who have multiracial backgrounds that include Asian heritage, nor does it include people with any Asian racial identity who self-identify as Hispanic (as may be common in the Filipino community, among others). Chinatown was 57% Asian, significantly more than the city as a whole, where Asians represented 34% of the population.9The difference in shares is statistically significant at a 99% confidence level, given the ranges including the estimates’ margins of error do not overlap.

Chinatown has a higher poverty rate than San Francisco overall. Exhibit 3 shows that 19% of the neighbourhood was found to be living below the poverty line in 2016, compared to 12% of the city. That difference is driven by family poverty. A significantly larger share of families in Chinatown live in poverty than in San Francisco; 17% of people in families live below the poverty line, more than twice the 8% share of all families in San Francisco.10The difference in shares for poverty rates overall and poverty rates among people is statistically significant at a 99% confidence level, based on calculated test statistics. The difference between poverty rates for people not in families is not statistically significant.

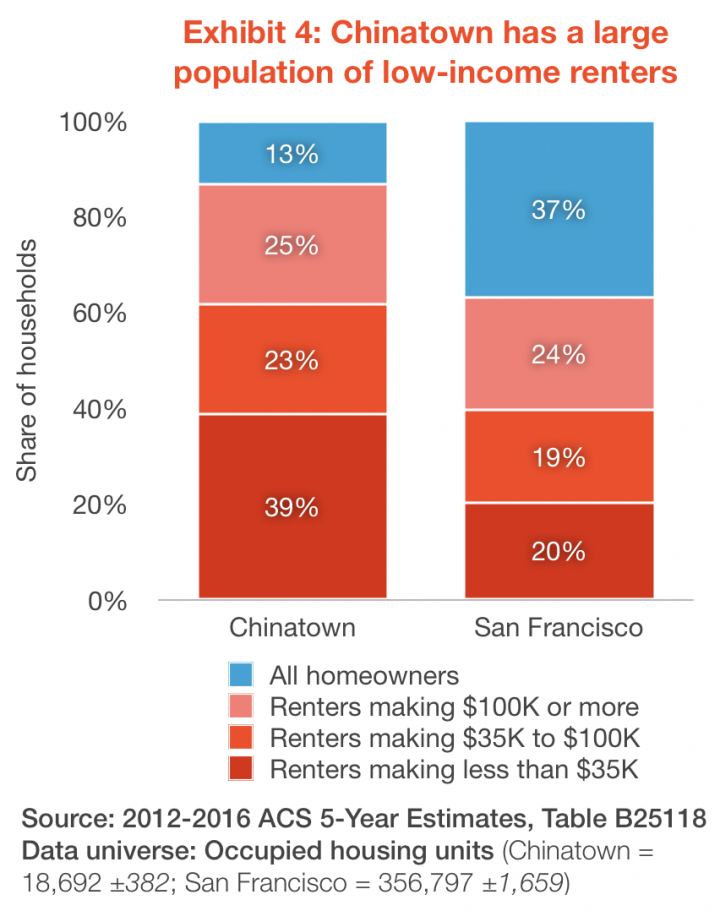
Another critical distinction between Chinatown and San Francisco comes in the way its residents live. Exhibit 4 shows the breakdown of housing tenure and household income in 2016. While 63% of San Francisco residents rent their homes, 87% of Chinatown’s residents do. The neighbourhood is home to a high concentration of lower-income renters, making less than $35,000 per year; 39% of all households fall into that category in Chinatown, nearly double the share of lower-income renters in San Francisco.11The differences in shares for each category is statistically significant at a 99% confidence level, with relatively small margins of error in both Chinatown and San Francisco.

These lower-income renters are the focus of this case study. With rents likely to rise as new developments cater to a wealthier population of higher-income renters, and improvements in transit like the Central Subway drawing commuters to the area, their vulnerability to displacement is key to understand.
Historical Displacement and Resilience in Chinatown
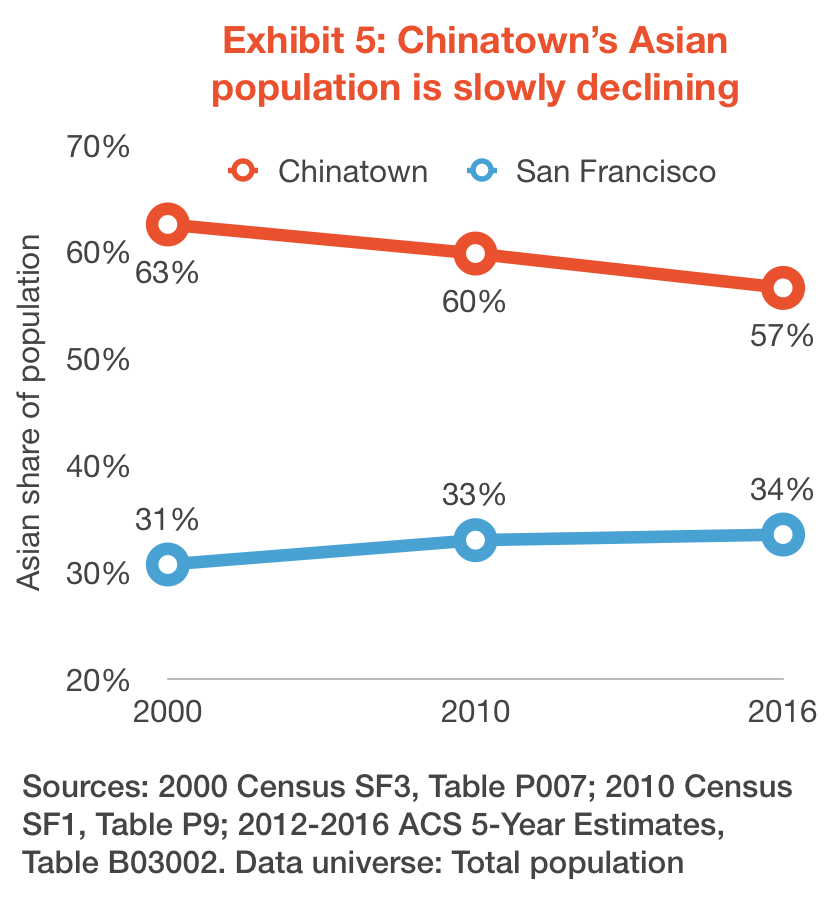
In the past few decades, Chinatown has mostly proven resilient to the displacement pressures it has faced—the core of the neighbourhood has preserved its population of predominantly Asian low-income renters. However, Exhibit 5 shows the Asian share of the population in Chinatown and San Francisco from 2000 to 2016, as a simple proxy for displacement. Over time, the wider neighbourhood is becoming less of an Asian enclave, with the share falling from 63% to 57% of the population. The total number of people identifying as Asian in Chinatown shrank by 14% from 2000 to 2016, while the Asian population of San Francisco grew 19%.12These numbers refer to the absolute number of people identifying as Asian in Chinatown and San Francisco, which is why they appear different to the graph in Exhibit 5. The difference in shares for 2016 was statistically significant at a 99% confidence level; for 2000, the gap between the two was large enough that a margin of error as high as that in 2016 would mean the same degree of statistical significance.
The Urban Displacement Project rated part of the neighbourhood—its traditional core—as likely to experience gentrification based on a set of indicators correlated with displacement elsewhere from 1990 and 2000 Census data. Reviewing their findings later, its researchers found that the neighbourhood had not gentrified or experienced major displacement as of 2013.13Mitchell Crispell and Nicole Montojo, Anti-Displacement Policy Case Study: San Francisco’s Chinatown (Berkeley, CA: Urban Displacement Project, 2016), https://www.urbandisplacement.org/sites/default/files/images/urbandisplacementproject_policycasestudy_chinatown_april2016.pdf, 2.
(While this does not reflect the share declines apparent in Exhibit 5, their analysis was only on one census tract in the neighbourhood.) Given its relative stability, the Urban Displacement Project chose the core of Chinatown as a case study for the effectiveness of anti-displacement policies. Evaluating the reasons that helped to insulate the neighbourhood from external pressures, they focused on the impact of city policies, and the advocacy of community organizations.
In 1981, San Francisco’s Board of Supervisors passed a citywide Residential Hotel Unit Conversion and Demolition Ordinance, providing new protections to single-room occupancy (SRO) housing units, after passing a moratorium on their conversion or demolition in November 1979.14“Residential Hotel Unit Conversion and Demolition,” San Francisco Department of Building Inspection, last modified October 15, 2018, accessed December 4, 2018, https://sfdbi.org/hco. The policies came in the wake of the fight for the International Hotel, an SRO property housing primarily elderly Filipino men on Kearny Street. In 1968, its owners began to try to evict the building’s tenants; for the next decade, a coalition of community organizations fought the owners, city, and police. On August 4, 1977, San Francisco police violently evicted the tenants and over 3,000 protestors that had formed a human shield around the building.15Brandon Yu, “International Hotel: 40 Years Later; A Community Lost, a Movement Born,” The Chronicle (San Francisco), August 11, 2017, https://projects.sfchronicle.com/2017/international-hotel/. While the tenants were displaced, the impact of the fight between the community and the city acting on behalf of its developer owners had its mark on the city’s politics, contributing to the decision to protect SRO properties.
The impact of the policy on Chinatown has been significant. In the Urban Displacement Project’s case study, the researchers note that over 50% of the housing stock in some of Chinatown’s core blocks remained SRO properties in 2008, and that the 1979 rent control ordinance had a significant impact on Chinatown’s SROs, protecting 92% of their units.16Crispell and Montojo, Anti-Displacement Policy, 5. Today, these SROs are a critical backstop to displacement for lower-income individuals and families in the area. A 2014 survey by a coalition of neighbourhood organizations found that the number of families living in SRO units rose 55% from 2001, with 74% of the families living in Chinatown’s SRO properties.17SRO Families United Collaborative, Living in the Margins: An Analysis and Census of San Francisco Families Living in SROs (San Francisco: SRO Families United Collaborative, 2015), http://www.chinatowncdc.org/images/stories/NewsEvents/Newsletters/sro_families_report_2015_.pdf, 9-10.
Perhaps the most significant contributor to the slower rate of displacement in the area comes from later advocacy. A coalition of groups, including the Chinatown Resource Center (a precursor to the prominent Chinatown Community Development Center) and the Chinese Chamber of Commerce, pushed for a major change to city policies in the 1980s. Chinatown had been considered part of San Francisco’s downtown for planning purposes, which meant that residential buildings were being pushed out by office conversions. In 1986, thanks to the organizations’ efforts, Chinatown was carved out as a distinct mixed-use neighbourhood with lower building height limits than the downtown area, and new anti-demolition protections for affordable housing stock.18Crispell and Montojo, Anti-Displacement Policy, 4-5.
Nonetheless, as the declining share of Asians as part of its population indicates, Chinatown has not escaped displacement completely. City policies have had an impact, but there remains potential for the neighbourhood’s vulnerable populations to be displaced in the future.
Future Displacement Threats to Chinatown’s Residents
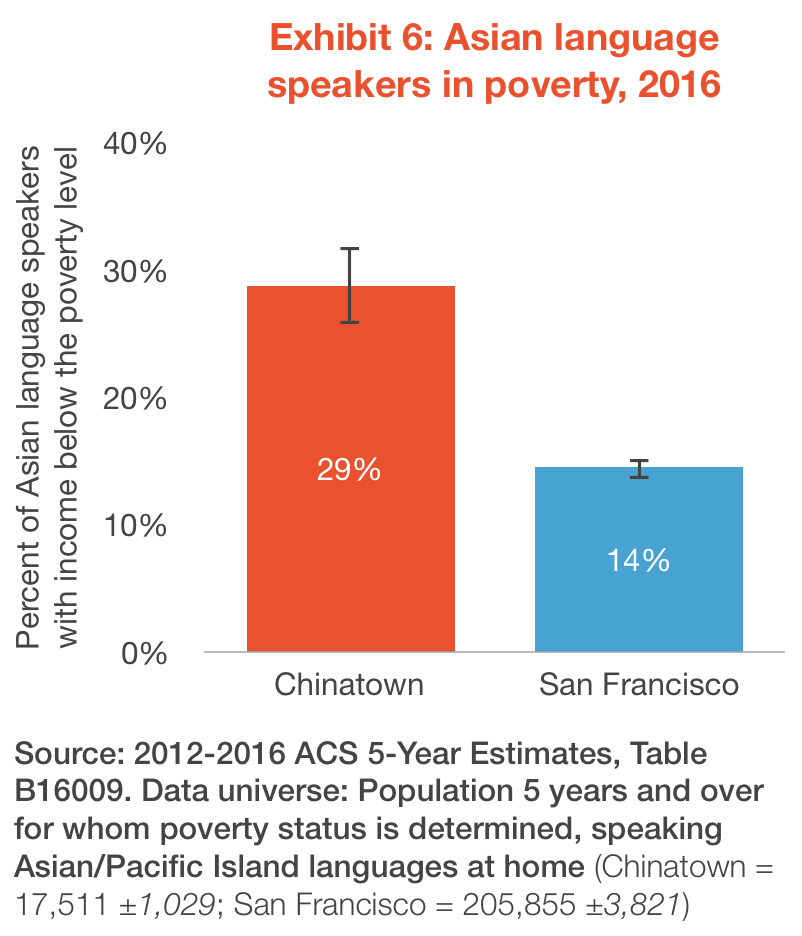
Chinatown today is an outlier within San Francisco. It has stayed true to its name, remaining an Asian enclave neighbourhood, despite the slow decline. Its high rate of family poverty, and its large share of lower-income renters, set it apart economically. Exhibit 6 shows the intersectional nature of these differences between Chinatown and the city. 29% of Chinatown residents who speak Asian languages at home live in poverty, more than double the poverty rate for Asian language speakers in San Francisco overall.19The difference in poverty rates among Asian language speakers in the two focus areas is statistically significant at a 99% confidence level, based on calculated test statistics.
The large communities of low-income Asian people and low-income renters in the neighbourhood stand out in particular when compared with Chinatown’s immediate surroundings. In maps of San Francisco, the neighbourhood’s unique character is clear. The following maps, Exhibits 7-9, show the census tracts chosen to represent Chinatown in the context of the city overall. Each shows an economic or housing indicator that demonstrates potential vulnerability to displacement among its residents.
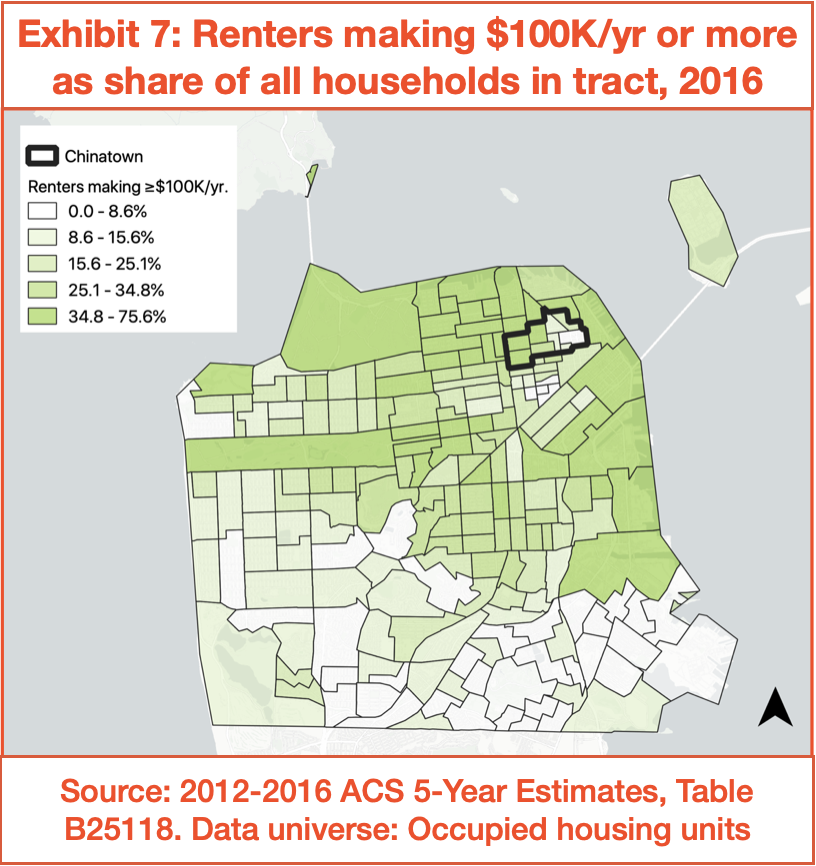
Exhibit 7 shows the share of households that rent and have an income of $100K or more per year. This indicator, shown previously in Exhibit 4, depicts the highest-income bracket of renters in the city; in Chinatown, 25% of all households fit this definition, in line with the 24% of households in the city overall. The map shows that the distribution of these households is less consistent than Exhibit 4 might make it seem. Chinatown has fewer of these households than its surroundings, with North Beach, the Marina, and the commercial districts of Downtown all having shares in the top quintile of the city’s census tracts.
This proximity of higher-income renters to the neighbourhood suggests that there is little about Chinatown’s location which might discourage higher-income populations from living there. Legal protections for the neighbourhood’s lower-income renters have likely been a reason why higher-income renters have not dominated the entire area (particularly its eastern tracts, which are in the bottom half of the city for share of higher-income renters).
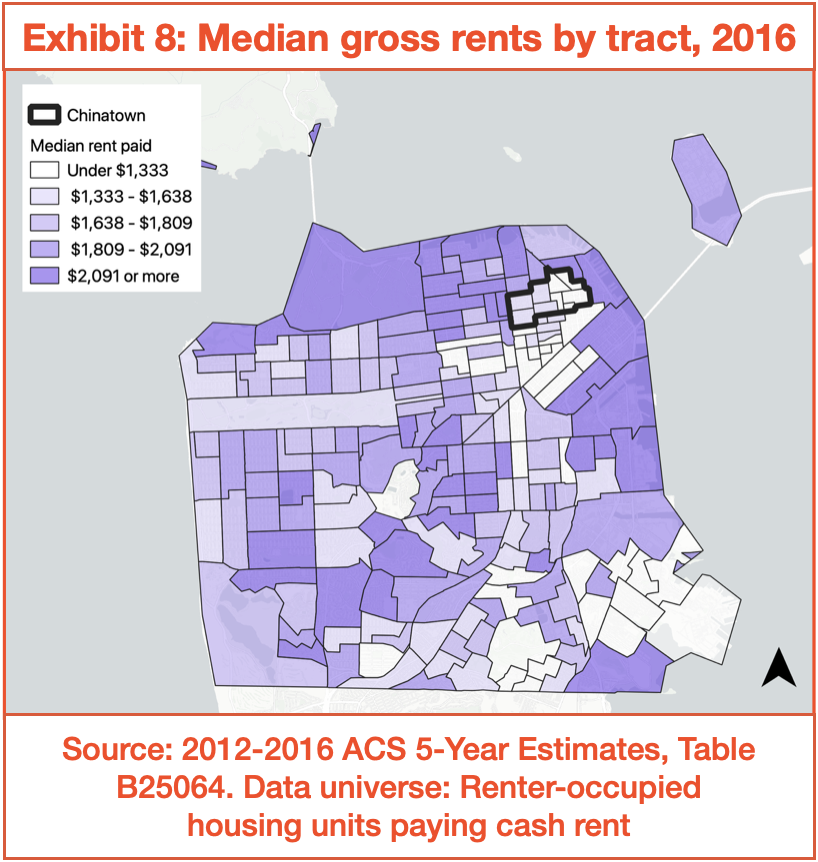
Exhibit 8 shows median rents for each tract in the city. Chinatown stands out, with most of its tracts in the bottom two quintiles for median rent in the city. While the Tenderloin to the south has similarly low rents, neighbourhoods to the north, west, and east all have some of the highest median rents in the city. This relative degree of affordability could ironically contribute to future displacement, as renters seek lower-cost housing close to the city’s core employment areas. With the coming opening of the Muni Metro Central Subway, and its stop in the heart of the neighbourhood, this threat could be compounded by rising market rents with properties suddenly located next to higher-order transit.
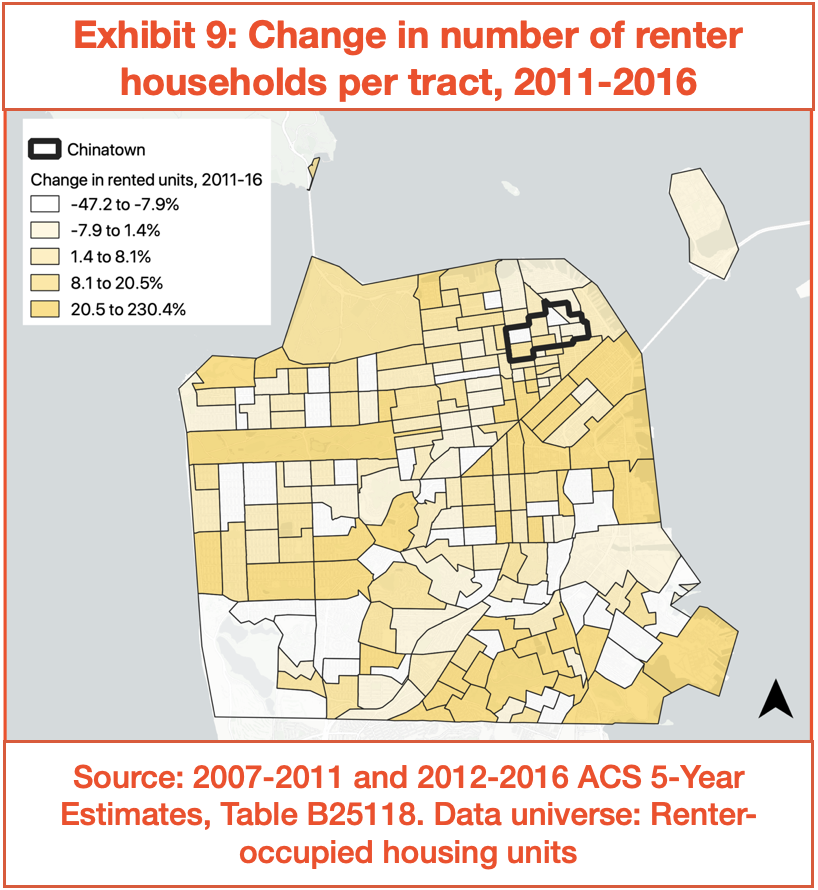
Exhibit 9 shows the change in the number of renter households in each tract from 2011 to 2016. Chinatown and its surroundings are more similar in this map, with relatively small changes in the number of renter households in their tracts. However, nearby neighbourhoods like SoMa and the Tenderloin show increases in renter households that fall within the top two quintiles of the city’s tracts. If this represents increased demand in the market for rental housing, Chinatown—with its relatively small change in number of rental households— may be a logical place for future construction. New buildings may cater to the higher-income renters common in Chinatown’s surroundings, changing the area’s economic and racial character.
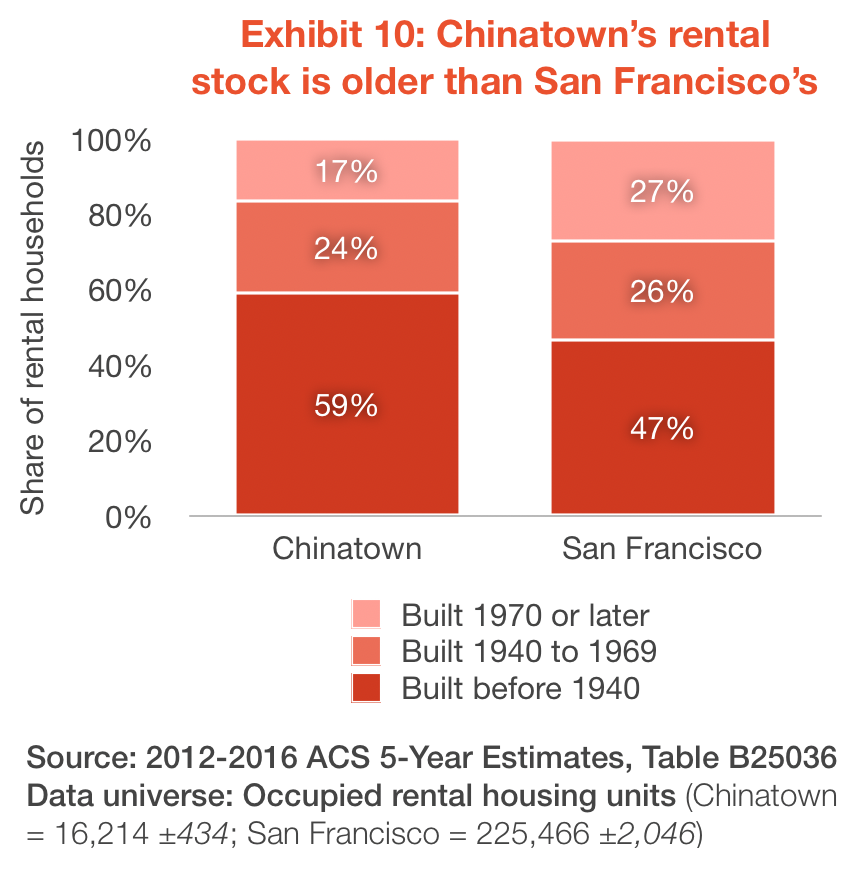
The combination of new higher-order transit, lower rents than its surroundings, and more rental units in nearby areas for higher-income renters attracted to San Francisco’s downtown neighbourhoods could have significant consequences on existing residents in Chinatown. Landlords may seek to renovate existing properties to increase rents and attract new kinds of tenant. Exhibit 10 shows the ages of rented housing units in Chinatown and San Francisco. 59% of Chinatown’s units were built before 1940, mostly in the wake of the 1906 earthquake; in the city overall, 47% of rented units fall into the same age category, a significantly smaller share.20The difference in shares of rental units built before 1940 is statistically significant at a 99% confidence level, based on calculated test statistics. This age gap means that Chinatown’s properties are more likely to be renovated and updated; local and state tenant protections mean that existing residents should mostly be insulated from the effects of these changes, but newly vacant units could be marketed to higher-income people.
The large number of SRO properties in Chinatown’s rental stock may be the first place to watch for this kind of displacement. While the city’s aforementioned SRO ordinance protects against demolition or conversion to other uses, they do not protect many residents from displacement due to renovation or repositioning of the properties to new tenant markets. 62% of families living in San Francisco’s SROs do not have a lease and technically rent on a day-to-day basis, making them more vulnerable than other renters.21SRO Families United Collaborative, Living in the Margins, 10. Anecdotal evidence cited by a joint report of the city and the Chinatown Community Development Corporation suggests that at least one SRO property in Chinatown has been upgraded and marketed at two to three times typical rents.22Sustainable Chinatown, Strategies for a Sustainable Chinatown (San Francisco: City and County of San Francisco, 2017), https://sustainablechinatown.org/wp-content/uploads/Strategies-for-a-Sustainable-Chinatown_WEB.pdf, 65.
Assessing the potential ability of lower-income renters to absorb some of these market pressures without being forced to move might indicate the urgency of these displacement threats. Exhibit 11 shows the results of an analysis of household net worth data from the Census Bureau’s Survey of Income and Program Participation (SIPP). SIPP is a longitudinal survey of several thousand households across America; each month, they provide information about their households, including incomes, assets, and debts. Data from SIPP has been used in the past by the Pew Research Center to show large gaps in wealth across racial groups.23“Wealth Gaps Rise to Record Highs Between Whites, Blacks, Hispanics,” Pew Research Center, published July 26, 2011, accessed December 4, 2018, http://www.pewsocialtrends.org/2011/07/26/wealth-gaps-rise-to-record-highs-between-whites-blacks-hispanics/.

Household net worth—calculated as total household assets net of debts—is a useful comparative tool to understand a given family’s financial security. Higher net worths indicate more protection against changes in their financial circumstances. A household with a higher net worth might have a higher income, a higher savings rate, or may simply have a large amount of other investments. Rising home prices have meant that homeowners have significantly higher net worths than renters, thanks to the value of the equity in their home.
Exhibit 11 seeks to understand the differences in financial circumstances among renter households in California and America. As the graph indicates, there is a wide gap in net worth between renters making less than and more than $35K per year. Higher-income renters likely benefit from their higher monthly cash flows; even without the benefit of home equity, California’s higher-income renters have net worths seven times higher than their lower-income counterparts. To assess what household net worth differences may mean for Chinatown, Exhibit 11 also shows the differences in net worth for Asian renter households making less than $35K, compared to households in all other racial groups. (Data is not available at levels more granular than a state.) On average, Asian lower-income renter households have net worths a little more than twice lower-income renters of other races. This difference is significant for America overall, but not in California, due to a small sample of Asian lower-income renters in the state.24Differences in net worth between higher- and low-income renters in both California and America are statistically significant at a 99% confidence interval. Differences in net worth between Asian and other renters in America are statistically significant at a 95% confidence interval; in California, the differences are not statistically significant, due to sample size.
This suggests that Asian lower-income renters may be somewhat more able to absorb increases in rent than lower-income renters in general. However, the gulf between higher- and lower-income renters’ net worths may be more salient to Chinatown. Their financial stability, in addition to their significantly higher monthly incomes, means that they can support rents that Chinatown’s existing renter population simply cannot. They are more attractive tenants for landlords, on a purely mathematical basis. Given the confluence of factors threatening to bring more higher-income renters into Chinatown, special focus should be given to the financial situations of lower-income residents, in order for the neighbourhood to continue fighting displacement in the future.
Conclusions
Chinatown has beaten the odds. As other low-income ethnic enclave neighbourhoods in San Francisco have become centres of gentrification and displacement with the rise of the tech industry, Chinatown has protected its unique community of residents. The neighbourhood’s long history of activism and strong community organizations made a difference; their work securing legal and policy protections for residents, especially vulnerable low-income renters, has contributed greatly to the population’s resilience. However, despite the relative stability of the community, it is becoming less of an Asian enclave, with fewer Asian residents as time goes on; this indicates that some degree of displacement is already occurring, however small.
In the near future, though, Chinatown’s residents face severe displacement threats—perhaps greater than at any point in the past several decades. In the past, people have sought to displace the neighbourhood for explicitly racist reasons; now, displacement may be a less-direct side effect of an economic transition in the area’s renter community. Rising rental rates in nearby neighbourhoods with more higher-income tenants indicate significant demand in San Francisco’s core for new apartments, especially those catering to residents of greater means than the historically low-income Chinatown community. The Central Subway looms over the neighbourhood, with the prospect improved transit services spurring new interest from renters and developers alike. The age of existing rental properties may make their renovations financially attractive to owners, gradually pushing out existing residents. Already-vulnerable SRO tenants may find more of their homes being renovated and marketed at higher rents than they can afford. Lastly, financial gaps between Chinatown’s residents and other higher-income renters mean that the community can only be resilient to a point in the face of market demand. The future is murky, but Chinatown’s residents may soon find themselves less able to stay put.
Limitations and Future Research Directions
This case study is by no means comprehensive. It focuses on a small subset of available indicators, and does not seek to provide an authoritative answer on the potential displacement of Chinatown’s residents. Instead, it focuses on economic and housing indicators to illustrate present conditions, with a limited review of historical conditions and resilience to displacement pressures in the recent past. This economic perspective is self-limiting; it assumes that the trajectory of San Francisco’s economy will continue apace, with inequality and new wealth serving to push lower-income communities off their crumbling footholds.
Furthermore, the economic analysis performed for this case study is not rigorously grounded in a review of academic literature on its constituent indicators. Many of the arguments put forward are commonsensical given economic impacts on individuals and families, especially those with limited financial resources. But conditions vary substantially from household to household; other research may be able to provide clearer conclusions from causally linked variables. Performing regression analysis to trace the impact of economic factors described herein over time may help to filter through the noise and find those most relevant for analysis.
A more thorough work may seek to interrogate the legacies of racist displacement pressure, which Chinatown faced repeatedly in its first century, from public and private actors alike. Today, explicitly racist pressure is less visible. But the community’s vulnerability may stem to some degree from its unique racial, linguistic, and immigrant communities within the city. Lower-income Asian enclave communities around America and the world have faced gentrification and displacement again and again—research that sites Chinatown’s circumstances more firmly in this legacy may flesh out connections less apparent from an economic perspective that assumes racially neutral actions.
On a similar note, this case study does not incorporate qualitative research conducted with members of the Chinatown community, instead drawing on secondary sources and primary datasets to draw its conclusions. It would be improved by an ethnographic approach that incorporates community perspectives—particularly because displacement and gentrification, and their associated pressures, are loosely defined and difficult to quantify.
In the future, research focusing on displacement in the community may benefit from a focus on the impact of the Central Subway. It has been repeatedly delayed; while the new station in Chinatown was originally supposed to open in 2016, as of this writing it has been delayed until at least late 2019. This has had a severe impact on local businesses, especially in the station’s vicinity, and its construction has represented a notable disruption in the lives of Chinatown residents. This case study does not do any direct analysis of its impact, and aside from a handful of news articles and offhanded references in other research, there does not appear to be any single source that examines its current and potential impacts deeply. Analyzing development applications and rental unit renovations could be fruitful, as could additional work to assess conditions in SRO properties in the neighbourhood.
Works Cited
“History of San Francisco’s Chinatown.” A&E Television Networks. Last modified August 21, 2018. Accessed December 2, 2018. https://www.history.com/topics/immigration/san-francisco-chinatown.
“Residential Hotel Unit Conversion and Demolition.” San Francisco Department of Building Inspection. Last modified October 15, 2018. Accessed December 4, 2018. https://sfdbi.org/hco.
“The Story of Chinatown.” KQED San Francisco. Published July 30, 1997. Accessed December 2, 2018. https://www.pbs.org/kqed/chinatown/resourceguide/story.html.
“Wealth Gaps Rise to Record Highs Between Whites, Blacks, Hispanics.” Pew Research Center. Published July 26, 2011. Accessed December 4, 2018. http://www.pewsocialtrends.org/2011/07/26/wealth-gaps-rise-to-record-highs-between-whites-blacks-hispanics/.
Avalos, George. “Bay Area Becomes 4-Million-Job Economy as Hiring Boom Widens.” The Mercury News (San Jose, CA), September 21, 2018. https://www.mercurynews.com/2018/09/21/bay-area-becomes-4-million-job-economy-as-hiring-boom-widens/.
Cespedes, Sydney, Mitchell Crispell, Christina Blackston, Jonathan Plowman, and Edward Graves. “Community Organizing and Resistance in SF’s Mission District.” In Case Studies on Gentrification and Displacement in the San Francisco Bay Area, edited by Miriam Zuk and Karen Chapple, 13-23. Berkeley, CA: Center for Community Innovation, 2015. https://www.urbandisplacement.org/sites/default/files/images/case_studies_on_gentrification_and_displacement-_full_report.pdf.
Chapple, Karen. Mapping Susceptibility to Gentrification: The Early Warning Toolkit. Berkeley, CA: Center for Community Innovation, 2009. https://communityinnovation.berkeley.edu/sites/default/files/mapping_susceptibility_to_gentrification.pdf.
Crispell, Mitchell, and Nicole Montojo. Anti-Displacement Policy Case Study: San Francisco’s Chinatown. Berkeley, CA: Urban Displacement Project, 2016. https://www.urbandisplacement.org/sites/default/files/images/urbandisplacementproject_policycasestudy_chinatown_april2016.pdf.
Ducker, Adam, Charles Hewlett, Patrick Lynch, Lindsay Duerr, and Elisabeth Putney Mygatt. Priced Out: Persistence of the Workforce Housing Gap in the San Francisco Bay Area. Washington, DC: Urban Land Institute, 2009. http://uli.org/wp-content/uploads/ULI-Documents/Priced-Out-San-Francisco-FINAL.pdf.
SRO Families United Collaborative. Living in the Margins: An Analysis and Census of San Francisco Families Living in SROs. San Francisco: SRO Families United Collaborative, 2015. http://www.chinatowncdc.org/images/stories/NewsEvents/Newsletters/sro_families_report_2015_.pdf.
Sustainable Chinatown. Strategies for a Sustainable Chinatown. San Francisco: City and County of San Francisco, 2017. https://sustainablechinatown.org/wp-content/uploads/Strategies-for-a-Sustainable-Chinatown_WEB.pdf.
Yu, Brandon. “International Hotel: 40 Years Later; A Community Lost, a Movement Born.” The Chronicle (San Francisco), August 11, 2017. https://projects.sfchronicle.com/2017/international-hotel/.
Zuk, Miriam, and Karen Chapple. “Executive Summary.” In Case Studies on Gentrification and Displacement in the San Francisco Bay Area, edited by Miriam Zuk and Karen Chapple, 1-9. Berkeley, CA: Center for Community Innovation, 2015. https://www.urbandisplacement.org/sites/default/files/images/case_studies_on_gentrification_and_displacement-_full_report.pdf.